Which TTS Voices Get Pronunciation Right? We Measured 12

A text-to-speech voice can sound perfectly natural and still say the wrong word. We measured 12 voices from four providers on minimal pairs, words that differ in a single sound. The best English voices carried 92–97% of the contrasts, the best Norwegian voices about 80%, and tonal accent was the weakest contrast for every voice. Here's how we measured it, with the spectrograms.
Contents
- Why we test voices at all
- What a minimal pair is, and why we measure only these sounds
- How to read a spectrogram, in one minute
- What are formants? Measuring vowel quality
- Vowel length: direction matters
- Voice onset time: hearing p vs b
- Pitch tracking and Norwegian tonal accent
- Can AI judge pronunciation? wav2vec2, Whisper and audio LLMs
- How we made sure the test is fair
- Results: which TTS voices get pronunciation right?
- What we do with this
- Limitations
- FAQ
Why we test voices at all
Every card in Taalhammer has audio, generated by text-to-speech in 76 languages. Learners copy what they hear. If a recording blurs the difference between two words, there's nothing to learn from it, and the learner will happily practise the blur.
Public TTS rankings don't help here. Leaderboards like Artificial Analysis rate how natural a voice sounds, how fast it is and what it costs. None of them checks whether a voice keeps apart the sounds that change meaning. For text to speech in language learning, that's the property that matters most.
What a minimal pair is, and why we measure only these sounds
A minimal pair is two words that differ in one sound, like Norwegian tak ("roof") and takk ("thanks"). We wrote about learning with them in our Norwegian pronunciation guide.
We measure only contrasts that change meaning and that an adult ear tends to filter out. We don't score how pleasant or expressive a voice is. These are the eight families we test, each with its own acoustic measurement:
| Contrast | Example | What we measure | ✓ when |
|---|---|---|---|
| Vowel length | tak – takk | vowel duration | long ≥ 1.25 × short |
| Vowel quality | lys – lus | formants F1–F3 | ≥ 0.8 Bark apart |
| Diphthongs | vei – vi | formant movement | ≥ 0.8 Bark apart |
| Voicing | ben – pen | voice onset time | ≥ 20 ms apart |
| Fricatives | kjekk – sjekk | centre of gravity of the noise | ≥ 500 Hz apart |
| [h] | hår – år | noise before the vowel | ≥ 8 dB louder |
| Retroflex | kart – katt | F3 at the end of the vowel | ≥ 150 Hz lower |
| Tonal accent | bønder – bønner | pitch contour | accent 2 falls ≥ 1.2 semitones further |
We ran this on 44 Norwegian pairs and 37 English pairs, chosen by word frequency, not by how any voice handled them. Every word was synthesised on its own, the way each provider's API is called in production: 1,788 recordings in total.
How to read a spectrogram, in one minute
A spectrogram shows sound as a picture: time runs left to right, pitch-like frequency bottom to top, and darkness is loudness. Vowels are dark, striped blocks. A stop like k is a blank gap followed by a burst of noise. That's enough to see the first contrast.
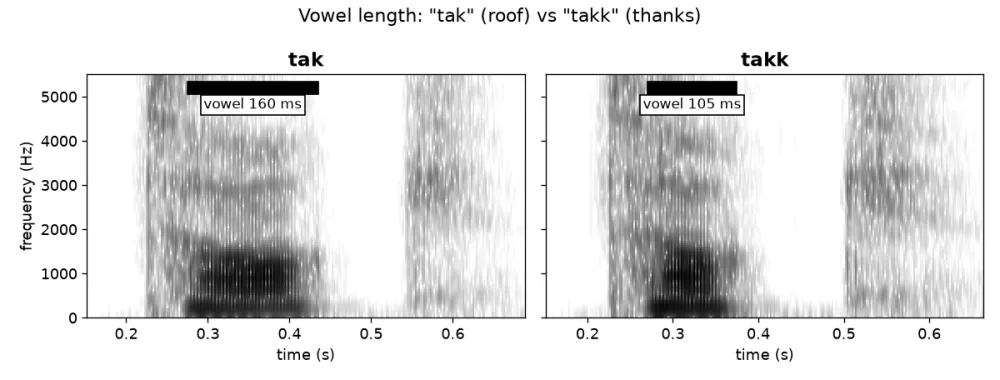
In tak the vowel lasts 160 ms, in takk 105 ms: a ratio of 1.52, comfortably past our 1.25 threshold. All figures here come from Praat, the standard phonetics program, driven from Python through Parselmouth.
What are formants? Measuring vowel quality
Your mouth is a tube that resonates at certain frequencies. Those resonances are formants, and they're what makes one vowel different from another. Roughly, the first formant (F1) follows how open your mouth is, the second (F2) how far forward your tongue is, and the third (F3) reacts to lip rounding and r.
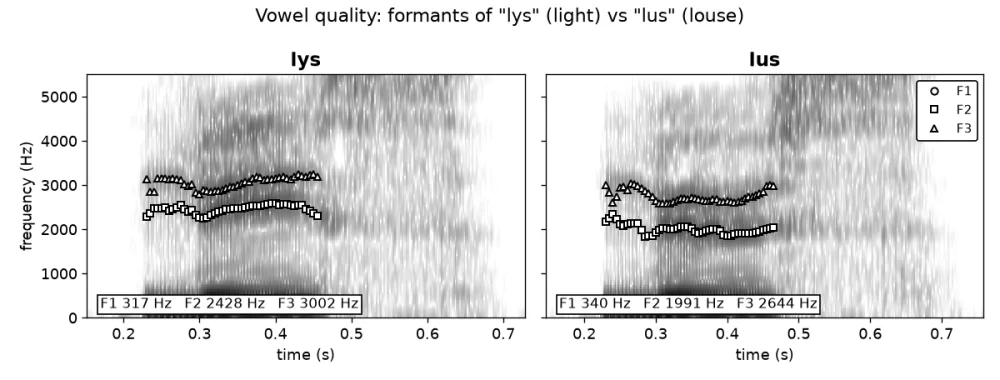
Norwegian y in lys ("light") and u in lus ("louse") are both high, rounded vowels. The difference sits in F2: about 2,430 Hz against 1,990 Hz, because the tongue is further back for u. To measure it we:
- find the vowel (loud, voiced, energy low in the spectrum);
- estimate formants with linear prediction (Burg's method) at several settings and keep the most stable one, since a single setting fails on some voices;
- take the median from the middle of the vowel, where it's steadiest;
- convert to the Bark scale, which follows how the ear perceives frequency, and call two vowels different when they're at least 0.8 Bark apart.
Diphthongs work the same way, except we compare where the formants start and end.
Vowel length: direction matters
Length looks easy: measure two vowels and compare. Two details made it harder. First, the vowel's edges must be found in the audio itself, not guessed from the spelling. We locate each letter with a speech-recognition model, then take the loud, voiced stretch around it. Second, the difference must go the right way. An early version of our tool happily passed a voice that made the short vowel longer.
Voice onset time: hearing p vs b
For consonants like p and b, what matters is timing. Voice onset time (VOT) is the gap between the release of the lips and the start of voicing.
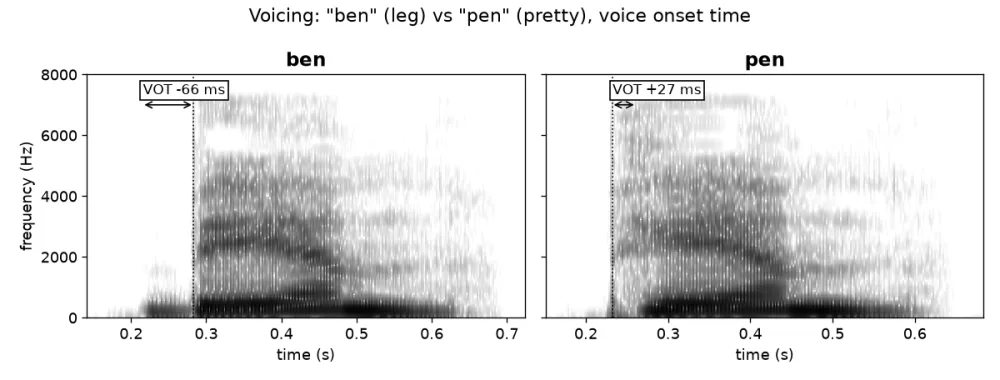
In ben ("leg") the vocal folds start vibrating 66 ms before the release: the low dark bar on the left. In pen ("pretty") they start 27 ms after it. We measure VOT with a sign for exactly this reason: an unsigned number can't see pre-voicing. For kj and sj we compare the "colour" of the noise (its spectral centre of gravity); for h we look for noise before the vowel.
Pitch tracking and Norwegian tonal accent
Norwegian has two tonal accents. The words bønder ("farmers") and bønner ("beans") share every vowel and consonant. Only the melody differs.
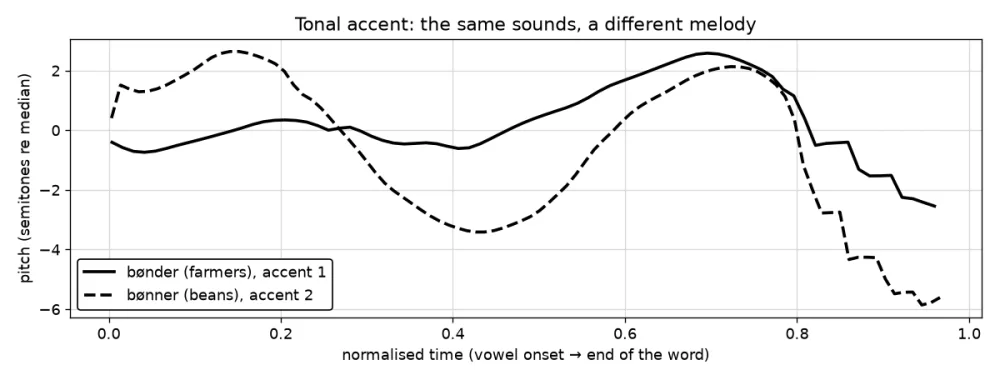
The melody is the fundamental frequency (F0), the rate at which the vocal folds vibrate. Pitch tracking estimates it frame by frame. Every tracker makes mistakes, such as jumping an octave, so we use two independent ones: Praat's filtered autocorrelation and pYIN. We convert to semitones and measure how far the pitch falls after its early peak. In the figure, bønner (accent 2) falls about six semitones before rising again; bønder stays almost flat. We count a contrast when accent 2 falls at least 1.2 semitones further.
Tone is where TTS voices struggle most. It's a melody over the whole word, and in our tests it was the weakest contrast for every voice.
Can AI judge pronunciation? wav2vec2, Whisper and audio LLMs
Acoustics alone can be fooled, so every verdict also needs a second opinion from a speech model.
- wav2vec2 (the Norwegian model from the National Library of Norway; an English one for English) recognises letters in audio. We ask it a forced choice: does the recording of takk fit the spelling takk better than tak? If it prefers the other word, the pair fails, however good the acoustics look.
- A second check compares the two recordings' internal representations. If they're practically identical, the voice said the same thing twice.
A pair passes only when the acoustics and the model agree. When they disagree, it's marked "unclear" and doesn't count as a pass.
We also tested whether newer AI could replace this. Three OpenAI audio models (gpt-audio, gpt-audio-1.5, gpt-audio-mini) heard one word and had to pick which of two it was. They got both words of a pair right in only 2–8 of 20 pairs, where guessing gives 5, and 0–1 of 4 tone pairs. Open speech-recognition models did better:
| Model | Pairs identified (of 20) | Tone pairs (of 4) |
|---|---|---|
| nb-whisper-medium (Norwegian Whisper) | 17 | 3 |
| wav2vec2, Norwegian | 15 | 1 |
| whisper-large-v3-turbo | 9 | 0 |
| OWSM v3.1 | 5 | 0 |
| gpt-audio models | 2–8 | 0–1 |
nb-whisper was the only model that heard tone. To be sure it was listening to pitch, we transplanted one word's pitch contour onto the other word's recording. Its answer followed the pitch in 5 of 6 cases. How the same kind of technology scores learners' pronunciation is explained in how pronunciation assessment works.
How we made sure the test is fair
A measurement that always says "different" is useless, so we tested the tool before testing voices:
- On 27 contrasts we had confirmed by eye on spectrograms, it said ✓ for 25 (93%). The other two came out as "unclear", never as a false pass.
- On 29 recordings with no real difference (the same word slightly resynthesised, pitch contours swapped, an h cut off), it gave a false ✓ once (3%).
- For every voice and every pair we added a control: the word against a resynthesis of itself. False passes stayed at 0–5% for all 24 voices, so the tool doesn't favour any provider.
With about 40 pairs per voice, each score has a margin of roughly ±12 points. Differences smaller than that are noise.
Results: which TTS voices get pronunciation right?
Percentage of minimal pairs where the contrast is measurably present:
| Voice | Norwegian (44 pairs) |
|---|---|
| Azure Iselin | 80% |
| Azure Finn | 77% |
| Azure Pernille | 77% |
| Google Chirp 3 HD Kore | 77% |
| Google Chirp 3 HD Charon | 68% |
| ElevenLabs v3 George | 68% |
| OpenAI coral | 68% |
| Google Chirp 3 HD Aoede | 66% |
| Google Chirp 3 HD Puck | 66% |
| Google Chirp 3 HD Leda | 64% |
| OpenAI ash | 64% |
| ElevenLabs v3 Lily | 59% |
| Voice | English (37 pairs) |
|---|---|
| Google Chirp 3 HD Puck | 97% |
| ElevenLabs v2 George | 95% |
| Azure Sonia (GB), Chirp Aoede, ElevenLabs Lily, OpenAI coral, OpenAI ash | 92% |
| Google Chirp 3 HD Leda | 89% |
| Azure Jenny, Chirp Charon | 86% |
| Google Chirp 3 HD Kore | 84% |
| Azure Andrew | 73% |
What stands out:
- Every voice is better at English than at Norwegian. Provider averages for Norwegian: Azure 78%, Chirp 68%, OpenAI 66%, ElevenLabs 64%. For English: ElevenLabs 94%, OpenAI 92%, Chirp 90%, Azure 84%.
- The top Norwegian voices tie within the margin of error. Azure's real edge is intelligibility: 94% of its words were recognised as themselves, against 84% for Chirp.
- Tonal accent was carried in only 17–67% of tone pairs, the weakest contrast for every voice.
- Azure Andrew does lengthen vowels before voiced consonants, but devoices the consonant itself, so his ridge is heard as rich.
- Some voices aren't deterministic. Chirp gave us different recordings for the same request (one tak had a 5 ms vowel, the next 260 ms), so a stored file must be measured, not assumed. Feeding Chirp the exact IPA pronunciation didn't help either.
What we do with this
No voice carries every contrast, and the differences between contrast types are bigger than the differences between providers. So we don't pick one "best TTS" and trust it. For each minimal-pair card we try voices until one is measured to carry the contrast, and pin that voice to the card. Then we check that the audio the app actually serves is the file we measured.
Every recording in our Norwegian pronunciation guide went through this test. For another look at how we build things, see how we built a true n+1 algorithm.
Limitations
We tested synthetic voices only, one Norwegian standard (Oslo), and a few pairs per contrast, which makes single cells in the tables noisy. We couldn't test Google's Gemini models in this round. Phonetic thresholds are calibrated on our own confirmed examples, not on a published benchmark.
FAQ
Is text-to-speech good enough to learn pronunciation from?
For English, mostly yes: the best voices carried 92–97% of the contrasts we tested. For Norwegian it's closer to 80%, so it's worth using audio that has been checked, and listening to several voices.
Which TTS voice is most accurate for Norwegian?
In our test, Azure Iselin scored highest (80%), with Azure Finn, Azure Pernille and Google Chirp 3 HD Kore close behind (77%). The difference between them is within the margin of error.
Why do TTS voices struggle with Norwegian tonal accent?
Tone is a melody over the whole word rather than a single sound, and it often carries no mark in the spelling. Every voice we tested carried it in at most 67% of tone pairs.
How do you measure whether a TTS voice pronounces a word correctly?
We compare it with its minimal-pair partner: we measure the acoustic feature that separates the two words (duration, formants, voice onset time or pitch) and check that a speech-recognition model also hears the right word.
Can ChatGPT or other audio AI tell if pronunciation is right?
Not reliably yet. The OpenAI audio models we tested identified Norwegian minimal pairs at close to chance level. A Norwegian Whisper model did much better and was the only one that heard tone.